Building a systematic trading strategy is easy. Believing the result is the hard part. This is a write-up of a small project I ran to teach myself the difference, and what it revealed about when trend-following actually works.
The question
Does a simple trend-following strategy make money? The honest answer I arrived at is more useful than a yes or a no: it depends entirely on the market you point it at. The same strategy, unchanged, went from worthless on one currency to robust on another, and the reason why is the whole point.
I set out not to find a winning strategy, but to learn to distrust a winning strategy. That turned out to be the more valuable skill.
The strategy, kept deliberately simple
The rule is a moving-average crossover, the “hello world” of systematic trading. Take a fast (50-day) and a slow (200-day) moving average of price. When the fast sits above the slow, the market has been trending up, so hold a long position. When it’s below, step aside and hold cash. Nothing more.
Underneath the mechanics, it’s a single bet: momentum: the assumption that an established trend tends to persist rather than instantly reverse. One critical detail: every position is taken on yesterday’s signal, never today’s. The signal is computed from the closing price, and you cannot trade on a close until after it has printed. Enforcing that one-day delay between deciding and trading is the difference between an honest backtest and a fantasy.
How I tried to break it
A backtest that hasn’t been attacked is worthless. I ran three deliberate attacks on every result:
- Transaction costs. You only pay when the position changes, not every day you hold. For this slow signal, turnover is low, so a realistic spread barely dented returns, a useful lesson in itself: costs punish fast strategies far more than slow ones.
- Look-ahead bias. I compared the honest version against a “cheating” version that peeks at the same-day close. The cheat looked better on every metric, and every bit of that improvement was fake, conjured purely from impossible timing. It’s the most common way a backtest lies, and it’s silent: no error, just a gorgeous curve you could never have traded.
- Overfitting. Rather than trust one lucky parameter pair, I swept a grid of fast/slow combinations and mapped the Sharpe ratio of each. The shape of that map is the tell: a smooth region of decent results means the edge is real; a lone bright cell surrounded by noise means you’ve fit an accident.
Result 1 — EUR/USD: no edge, and that’s a finding

On EUR/USD, the sweep was a wash. The best cells were isolated islands – a Sharpe of 0.18 sitting next to neighbours at 0.02 and −0.03. Nudge any parameter one step and the result collapsed. There was no coherent green region anywhere.
The reason is structural, not a tuning problem: EUR/USD is mean-reverting. Over the last decade it has oscillated in a broad range rather than sustaining long directional moves. Trend-following needs trends to feed on; feeding it a range-bound market is the wrong tool for the job, and no amount of parameter tuning fixes a tool/market mismatch. Proving that robustly, across twenty combinations, not one is a genuine result. Most blown-up strategies are run by people who found the one 0.18 cell and stopped looking.
Result 2 — USD/JPY: the same strategy, with a real edge
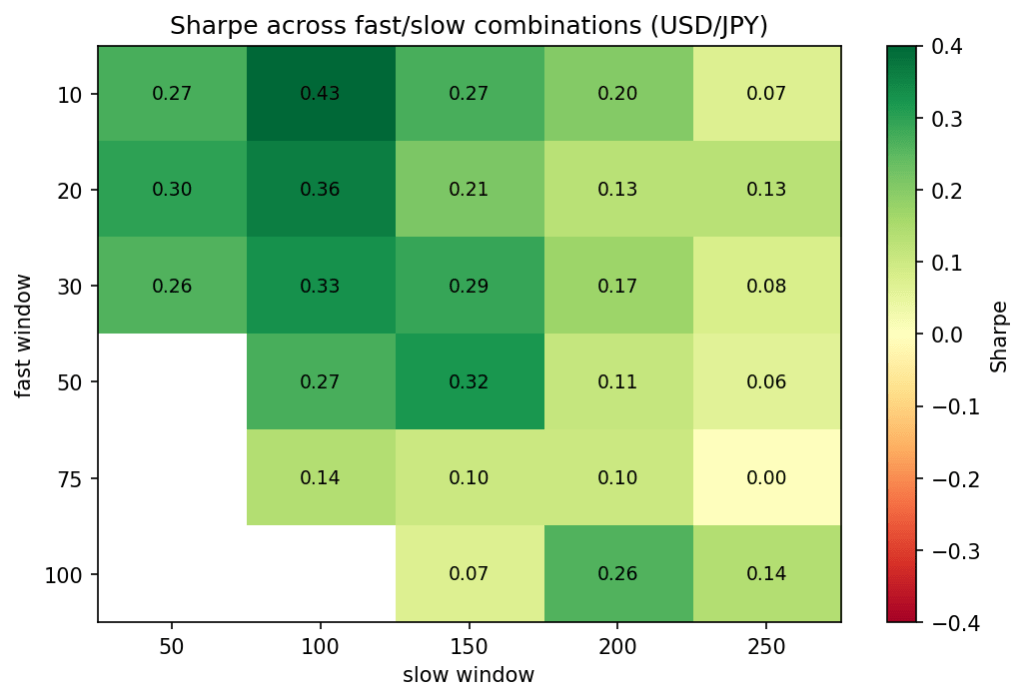
I changed one variable, the instrument, and re-ran the identical pipeline. The map transformed. Instead of scattered pixels, a whole connected block turned green: a top cell around 0.43, surrounded by a neighbourhood of 0.27 to 0.36. The edge no longer hinged on one lucky window; almost any reasonable choice made money. That is what robustness looks like, and it’s what tells you you’re looking at signal rather than noise.
The economic reason: USD/JPY produced a powerful, sustained trend through 2022–2024 as the yen fell sharply. The strategy rode that trend and stepped aside during the choppier pullbacks, exactly the behaviour it’s designed for.
So the core finding, stated plainly: a trend-following strategy is not “good” or “bad” in the abstract. It is regime-dependent. It fails in mean-reverting markets and works in trending ones. Same code, opposite outcomes, because the two markets behave differently.
Sizing the bet: volatility targeting
A binary in-or-out position takes the same size whether markets are calm or in crisis, so your actual risk drifts uncontrollably. The fix is to scale the position toward a chosen risk level, bigger when calm, smaller when volatile. But the direction it moves you depends on where you set the target relative to the strategy’s natural volatility, and that produced the most instructive result of the project:
| USD/JPY | Annual return | Annual vol | Sharpe | Max drawdown |
|---|---|---|---|---|
| Binary (all-in/all-out) | 0.70% | 6.42% | 0.11 | −17.5% |
| Vol-targeted at 10% (above natural) | 1.02% | 7.84% | 0.13 | −26.2% |
| Vol-targeted at 5% (below natural) | 0.55% | 3.94% | 0.14 | −13.9% |
The strategy’s natural volatility was 6.4%. Target above it, and vol-targeting levers you up, more return, but a deeper drawdown. Target below it, and it sizes you down, calmer, with the smallest drawdown of the three.
Setting the target above natural volatility didn’t reduce risk: it added leverage, and the drawdown got worse, not better. Setting it below smoothed the ride and cut the drawdown. The lesson: volatility targeting moves your risk toward a level you choose, up or down. It only “smooths” things if you point it below where you already are. It improves how you take a bet; it cannot turn a weak signal into a strong one.
Extending to rates: a natural home for trends
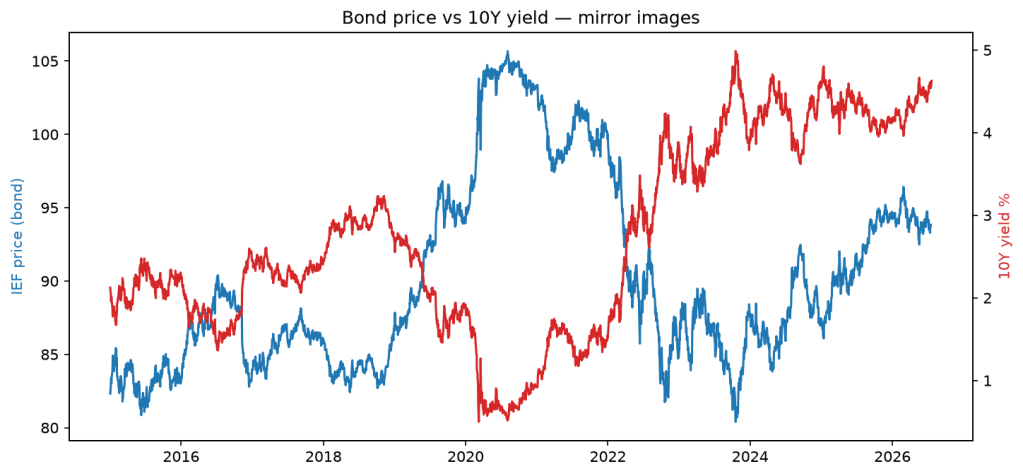
Fixed income is where I’d expect trend-following to work for a defensible reason. Central banks move in slow, multi-year cycles, hiking for two years, holding, then cutting, and that policy persistence creates price persistence, which is exactly what a trend-follower needs. Unlike a currency that drifts for no particular reason, a rates trend has a macro engine you can name.
The chart above is the foundational relationship in fixed income: a bond’s price and its yield move inversely. When yields tripled in the 2022 hiking cycle, bond prices suffered one of their worst years on record. A trend strategy running on bond prices should detect that downtrend and step aside: the same crash-dodging that worked on USD/JPY, but driven by an economic cause rather than luck. Building and stress-testing that systematic rates version is the next iteration of this work.
What I don’t trust
Research notes:
- Raw returns, not excess returns. The Sharpe ratios above are computed on raw returns, without subtracting the risk-free rate. With cash yielding 4–5% for much of the recent period, a strategy earning under 1% a year is not making money; it’s destroying it relative to a T-bill. On an excess-return basis, these thin edges very likely turn negative. The reported figures are optimistic upper bounds.
- One dominant trend. Much of the USD/JPY result rests on a single episode: the 2022–2024 yen decline. A strategy carried by one great move may be a one-trick pony; it needs testing with that period excluded.
- In-sample, single-instrument. These are single markets over a single history with no held-out out-of-sample period. Robustness across the parameter grid is encouraging, but it is not the same as robustness across time and instruments.
- Idealised execution. Beyond a flat spread assumption, the backtest ignores slippage, financing/carry on held positions, and the realities of trading at size.
What I actually took away
The point of this was never the P&L. It was the reflexes. Three that will outlast the specific strategy:
- A strategy is only as good as its regime. Ask “in what market conditions does this work?” before “does this work?”
- Backtests lie until you attack them. Look-ahead bias, ignored costs, and overfitting each quietly manufacture fake performance. The habit of trying to break your own result is the entire job.
- A clean negative is real research. Proving that trend-following doesn’t work on EUR/USD, robustly, is worth more than cherry-picking one lucky number and believing it.
Simple single-instrument strategies generally don’t beat cash. Discovering that honestly, rather than being fooled by a raw-return backtest, is exactly the discipline worth building.
Built in Python (pandas, yfinance). This is a personal learning project and a note to self, not investment advice.